

YOURCO'DESIGNERforDATA STORIESDesigned Power BI reports, by you or your agent.Pick a palette, a structure and your pages. ChartCraft forges a real .pbip that opens in Power BI Desktop: report, theme and model, on our sample data or bound to yours.
No account needed to try. 120 free tokens on sign-up, 30 per report.


Designed, not templated
Palettes, page structures, KPI cards and charts drawn for Power BI, so the report looks finished before your data arrives.
A real .pbip
PBIR report, theme and TMDL model in one project. Open it in Power BI Desktop and keep editing like any report.
Bound to your model
Bind it to your own semantic model, from the app or from Claude Code and Cursor. Names only, never your data.
Familiar interfaces, modern design.


Outcomes
From blank canvas to boardroom-ready.
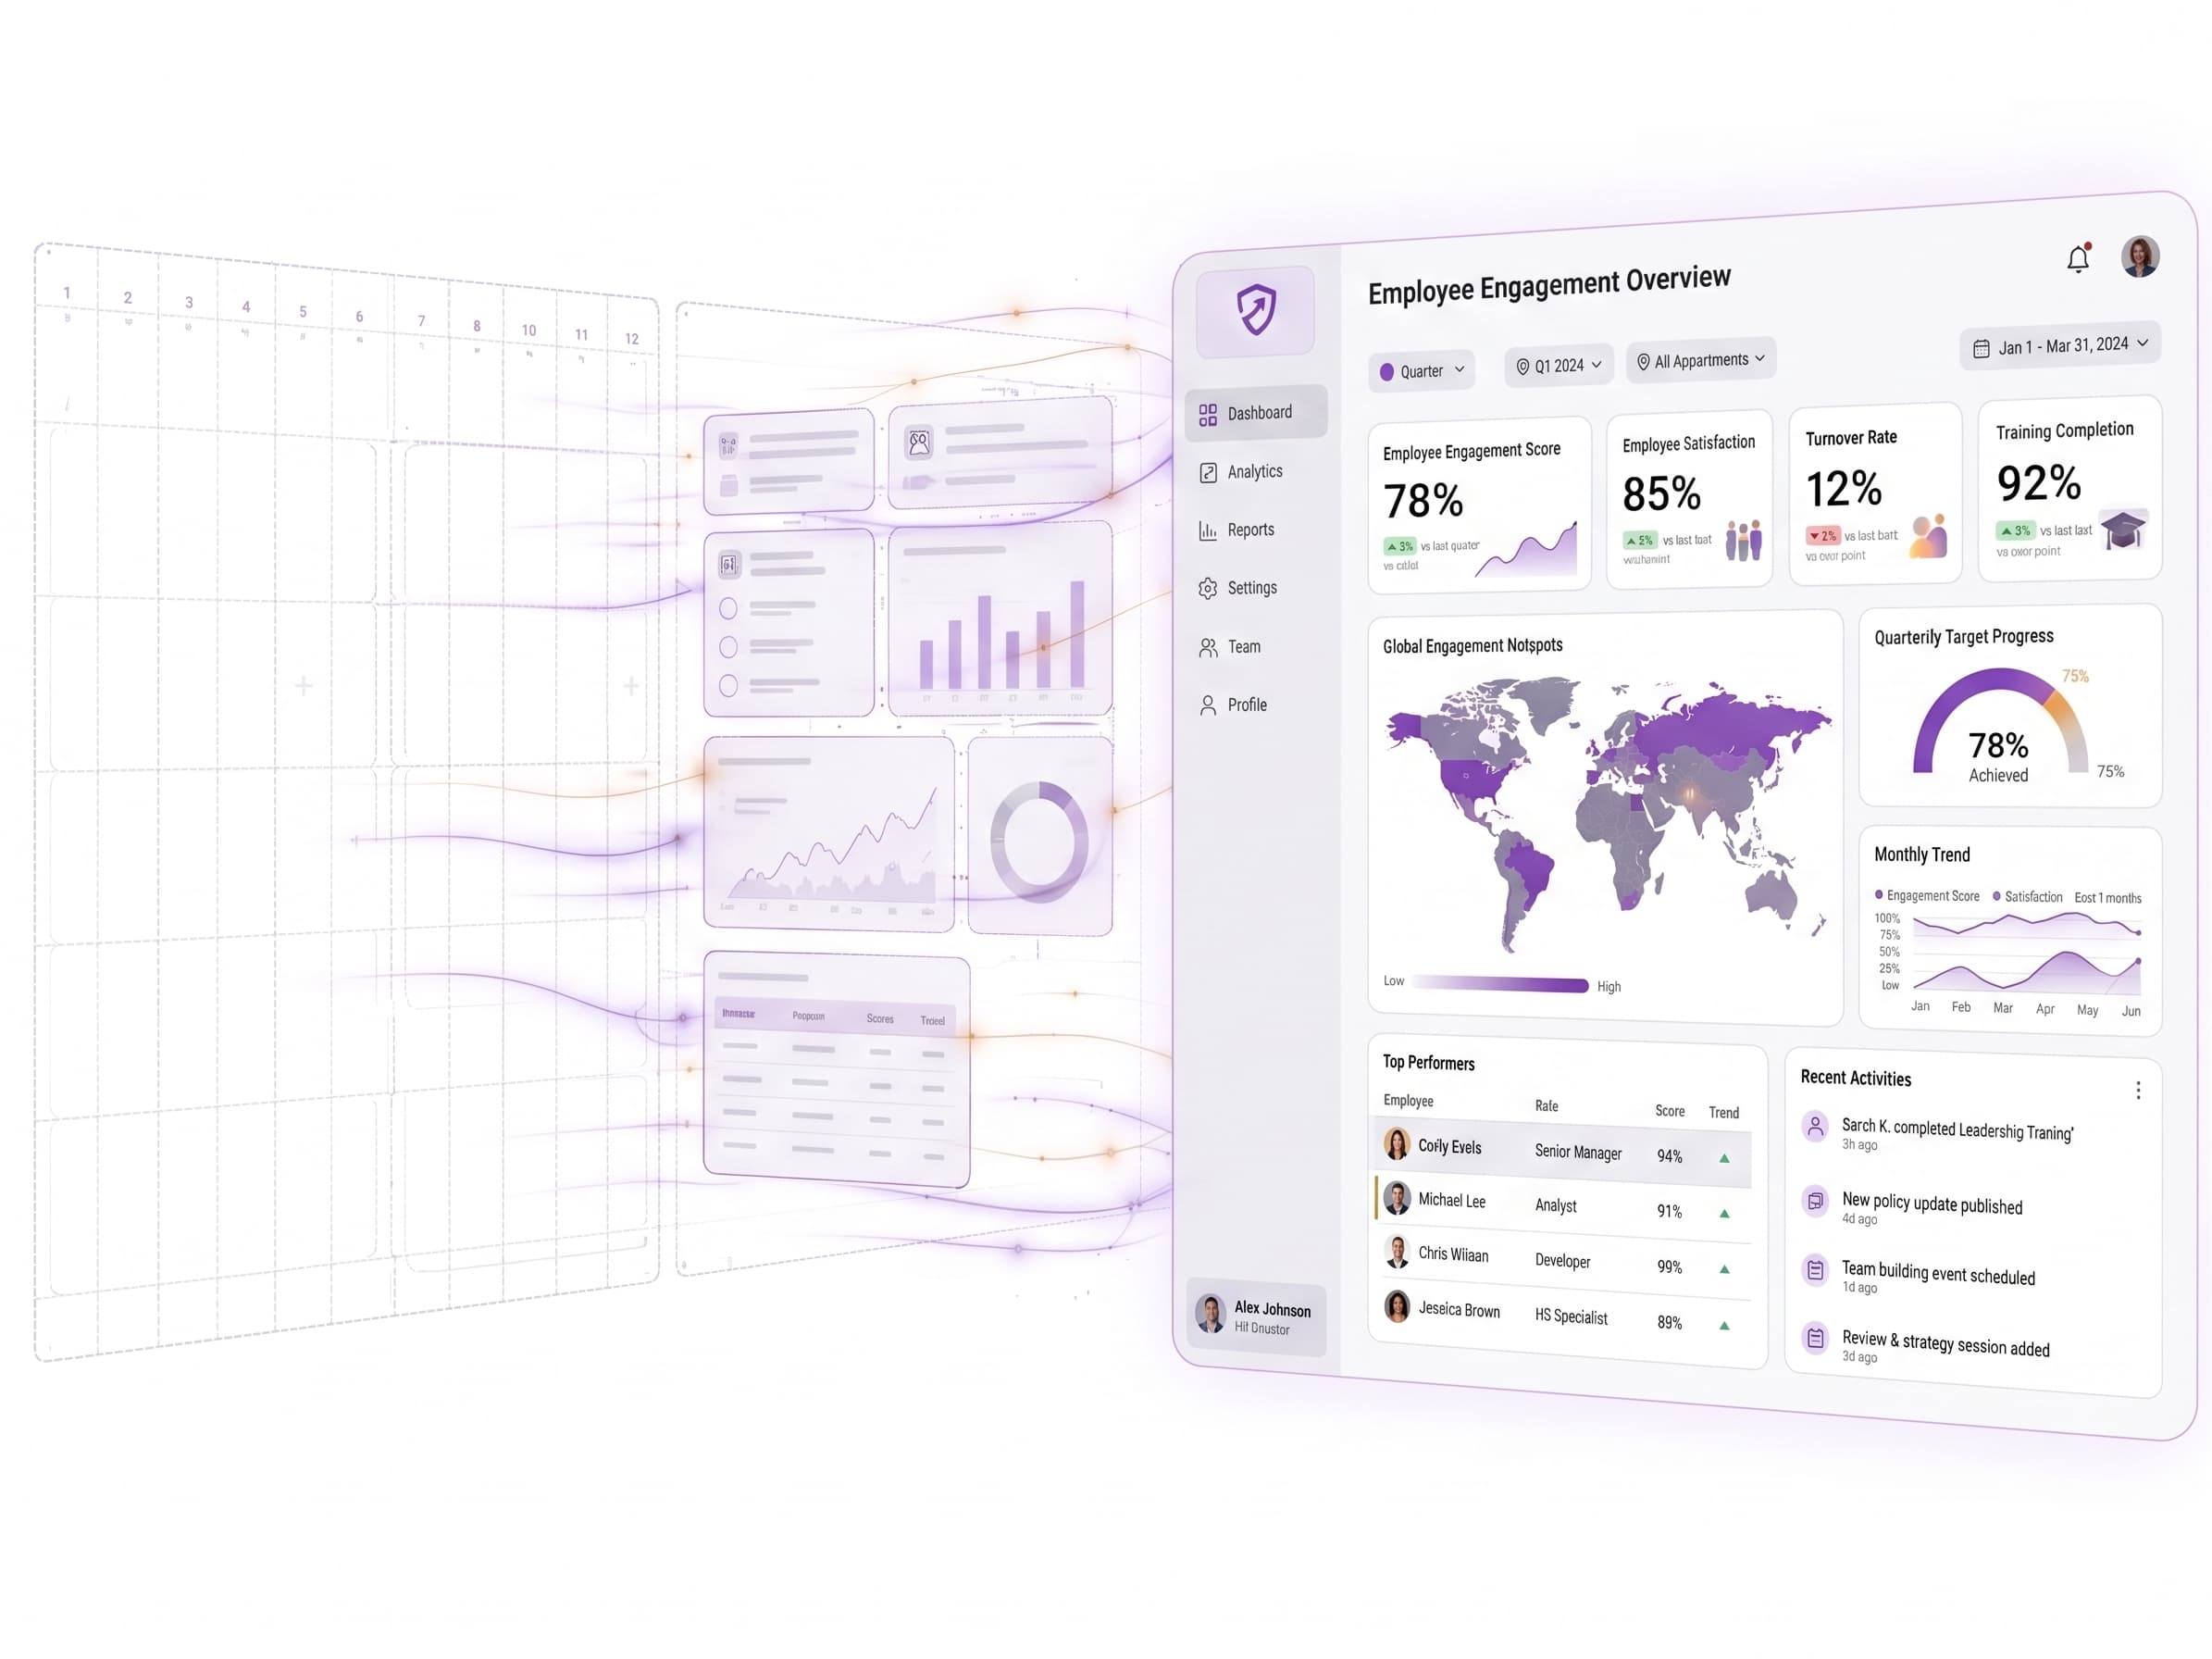
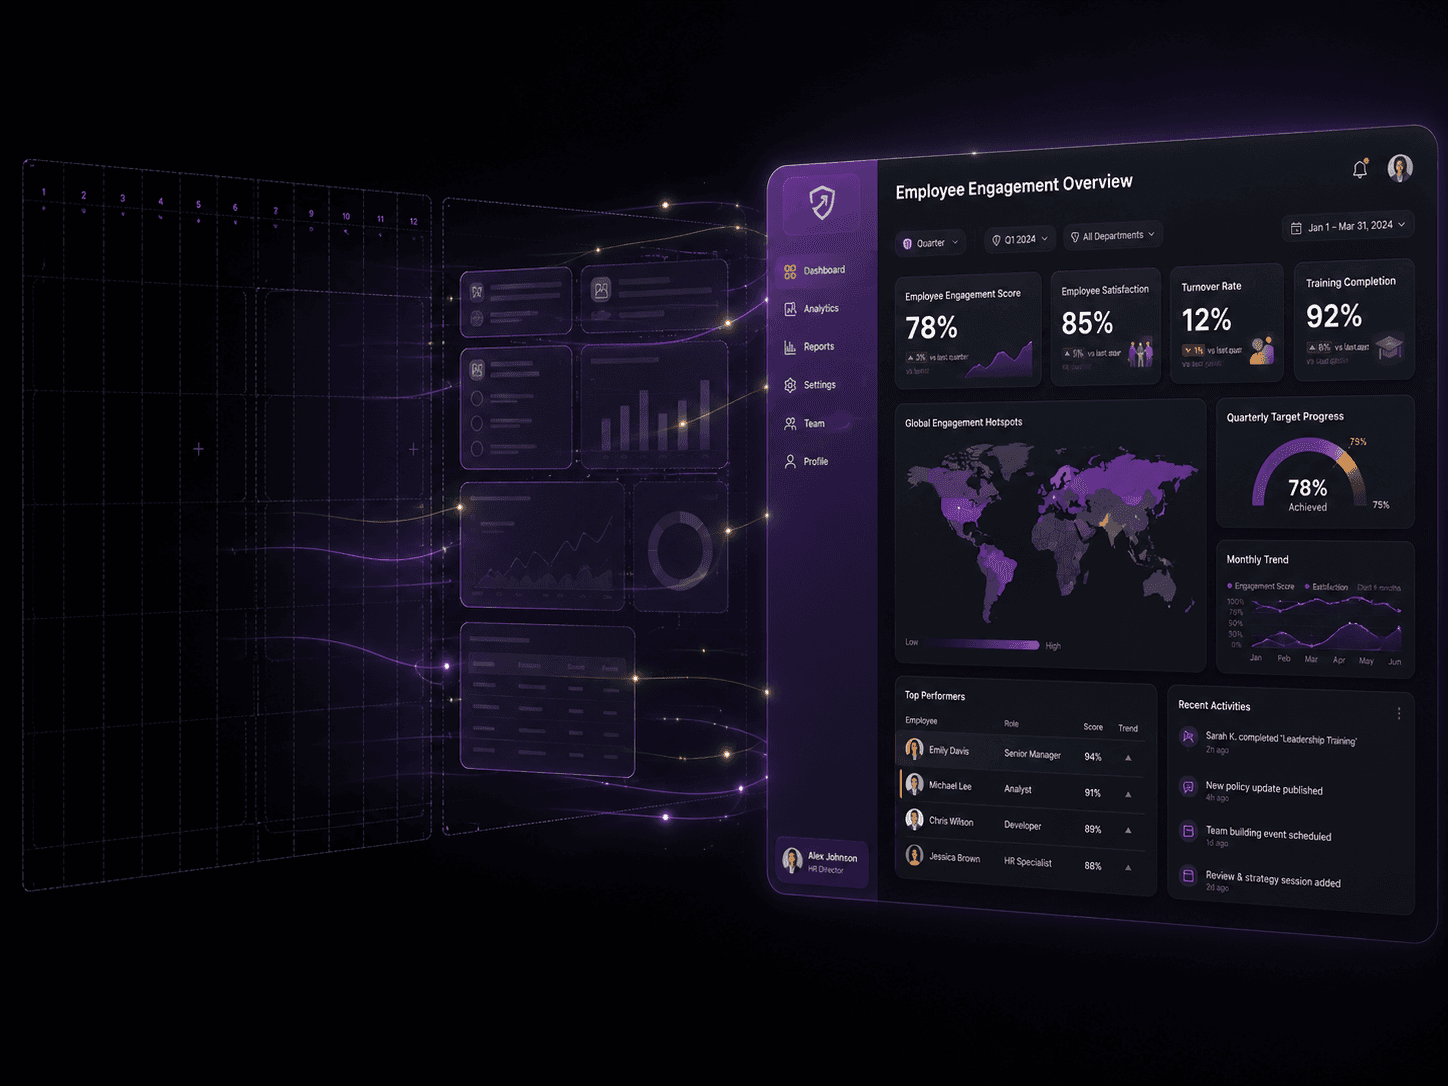
Never face a blank canvas
Start from a plain-text brief or a curated inspiration — never an empty screen.


Designed, not just generated
Hierarchy, layout and palette crafted the way a designer would — best practices baked in.


Ship at scale, in minutes
Hours of dashboard work compressed into minutes — produce dozens, on-brand, without a design team.
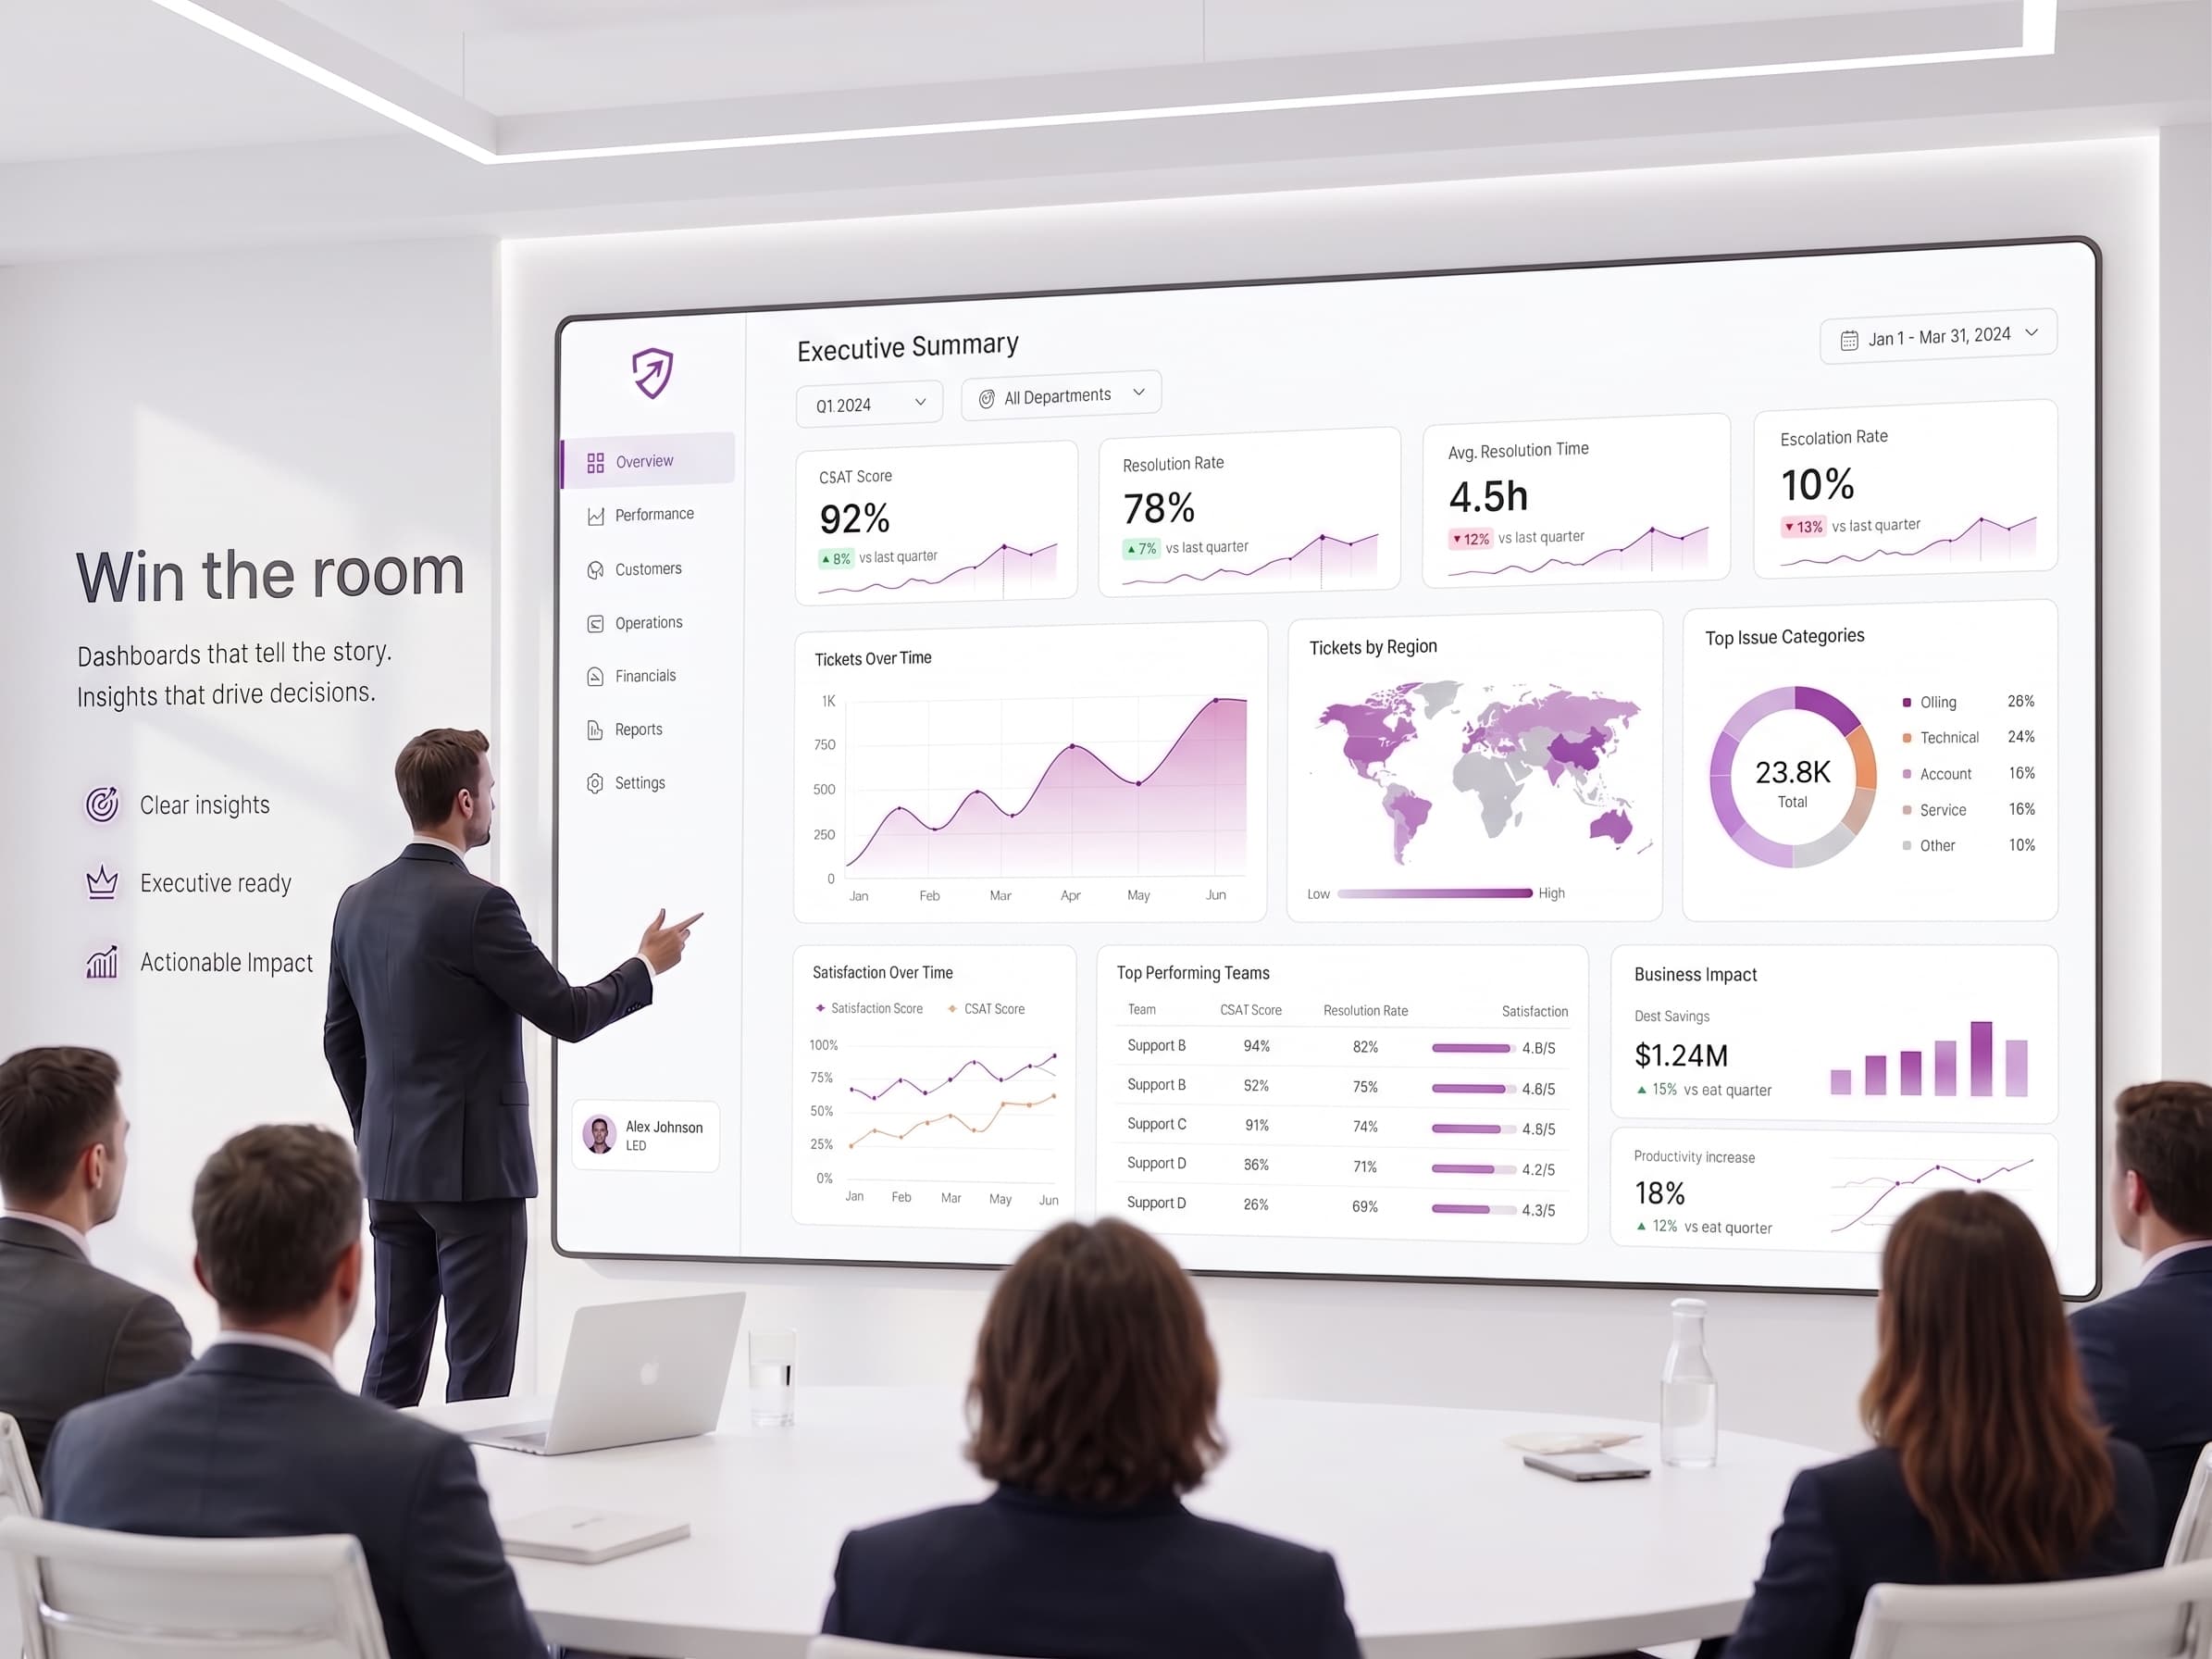
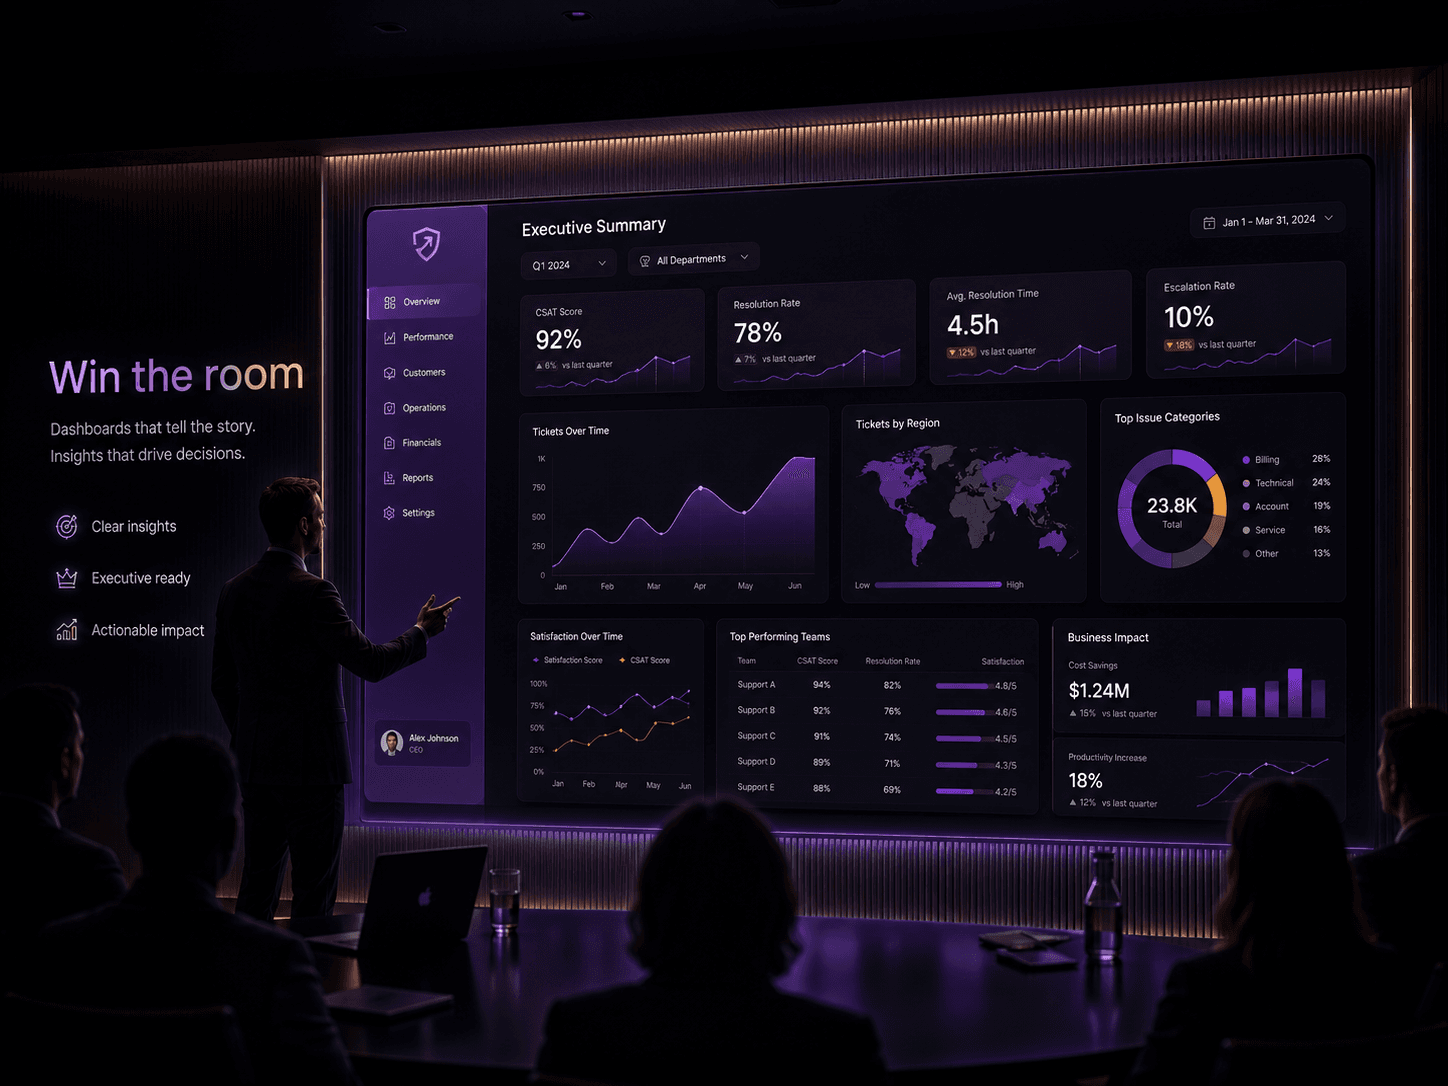
Win the room
Board-ready visuals that restore trust with execs and clients.
Build dashboards
That Tell Stories
Build dashboards
That Tell Stories


Dashboards Created with AI
Powered by ChartCraft
What BI tool do you prefer?
Ad-hoc Charts
Our mission
AI Analysis Score
ChartCraft Journey
"I built ChartCraft so any team ships designer-grade dashboards in minutes."
Latest update
NewForgeBeta
Not a mockup.
A real Power BI project.
Forge compiles your design into a .pbip: PBIP project, PBIR report, TMDL model. You open Desktop to connect your data, not to rebuild the design.
- A multi-page .pbip that opens in Power BI Desktop, demo data embedded.
- Native visuals, Deneb charts, embedded theme, sidebar and bookmarks, all wired.
- Plain text files you can edit in Desktop, version in Git and iterate with AI.


 Power BITableauSoonLookerSoonQlikSoon
30 tokens per project, on every plan. You get a zip: unzip it, open the .pbip in Desktop, click Refresh once.
Materials
A design system for your dashboards, in your colors.
A curated library of surfaces and scenes, in every palette, that you compose and re-tint in one click.
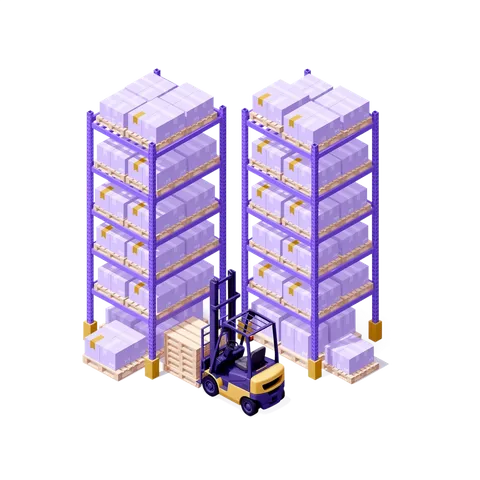
- Backgrounds, sidebars, cards, heroes, animated 3D scenes and isometric dioramas.
- Compose full dashboard mockups, then switch the whole palette in one click.
- Generate any asset in your own brand colors with the Custom Studio.






Design dashboards
That Inspire
Describe your dashboard vision in natural language and let AI transform it into a fully functional, beautifully designed dashboard. Our advanced AI understands your business context and automatically selects the most appropriate charts, layouts, and color schemes to bring your data to life. No coding required.


Get actionable
Suggestions
Receive smart recommendations that go beyond aesthetics. We analyze data patterns, user behavior, and industry standards to suggest improvements. From suggesting alternative chart types to recommending KPI prioritization, our AI helps you create dashboards that drive better decisions and enhance user engagement.
Improvements
Optimizing grid structure and spacing improves visual hierarchy and readability
By enhancing contrast ratios and color harmony we improve accessibility and visual appeal
By selecting appropriate chart types we enhance data comprehension and user engagement
Smart insights
Key Performance Focus
MediumSpecific recommendation based on the dashboard title and main objective.
Data Storytelling
HighHow to present the data to tell a compelling story about the objective.
Actionable Metrics
MediumWhich metrics will drive the most impactful decisions.


Analyze your existing
Designs
Get instant, intelligent feedback on your dashboard designs. Our AI evaluates layout efficiency, color harmony, data clarity, and user experience. Receive detailed recommendations on spacing, typography, accessibility, and best practices tailored to your specific use case and industry standards.
Increase text contrast for better readability against the dark background.
Use a more readable font for smaller text elements.
Align chart titles consistently.


See the fully enhanced
Result
Watch your dashboard transform into a polished, production-ready interface. Every element is refined for clarity, performance, and visual appeal. Export your designs to Power BI, Tableau, or other BI tools, or save them to your project library for future iterations and team collaboration.
Enhanced Version
PREVIEWScore Analysis
Color Harmony
Excellent
Layout Balance
Good
UX Score
Excellent
Accessibility
Good
UX Design
Color Harmony
Improved color palette for better readability
Layout Balance
Optimized spacing and component arrangement
Accessibility
Enhanced contrast and navigation support
User Flow
Streamlined navigation and interaction patterns
Build Notes
Performance
Optimized rendering and data loading
Code Quality
Enhanced type safety and error handling
Documentation
Updated API references and examples
Testing
Comprehensive test coverage and validation


From blueprint to production
Designed in ChartCraft,
shipped in your BI tool
You get the layout and the insights, the design and the analytical direction. No blank canvas: rebuild it in Power BI, Tableau or Looker with confidence. Below, real reports built straight from ChartCraft blueprints.
Production Line Efficiency
See the report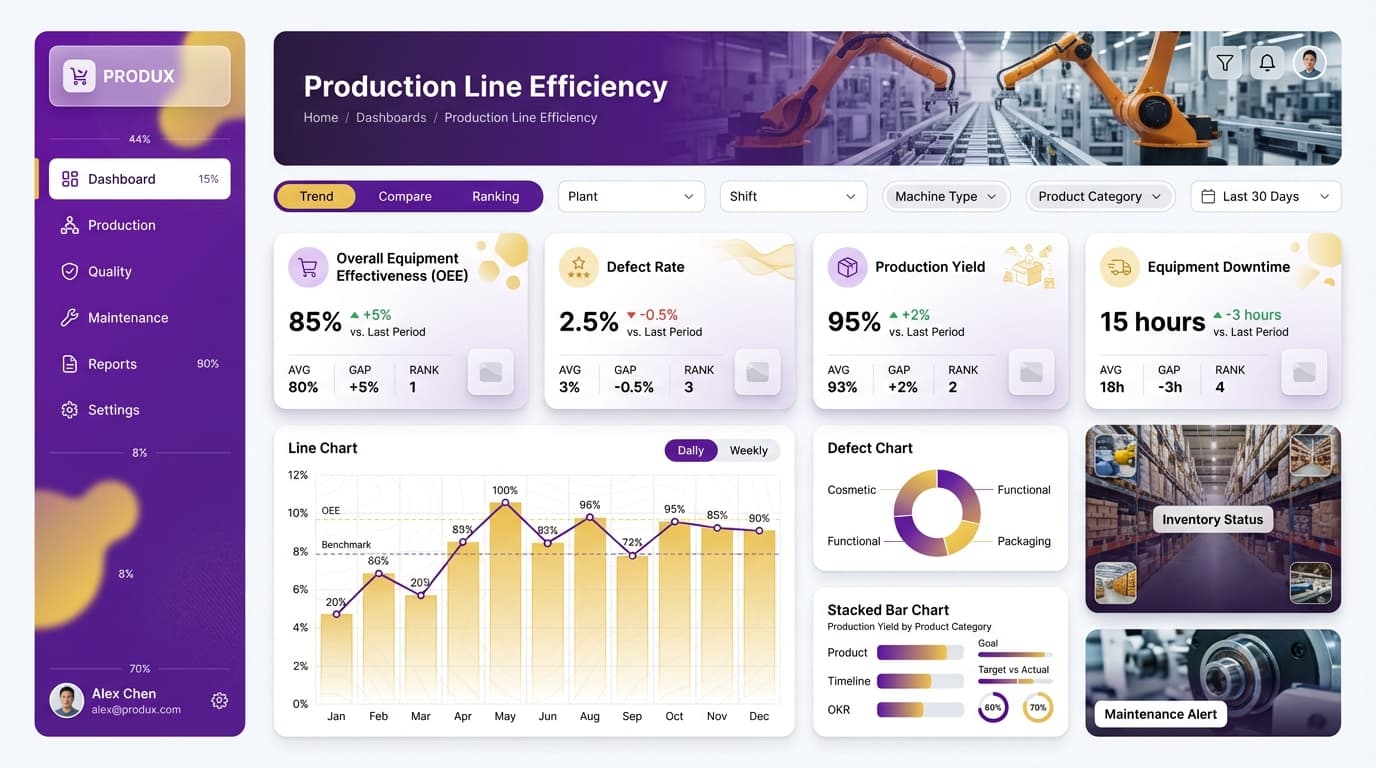
Employee Retention
See the report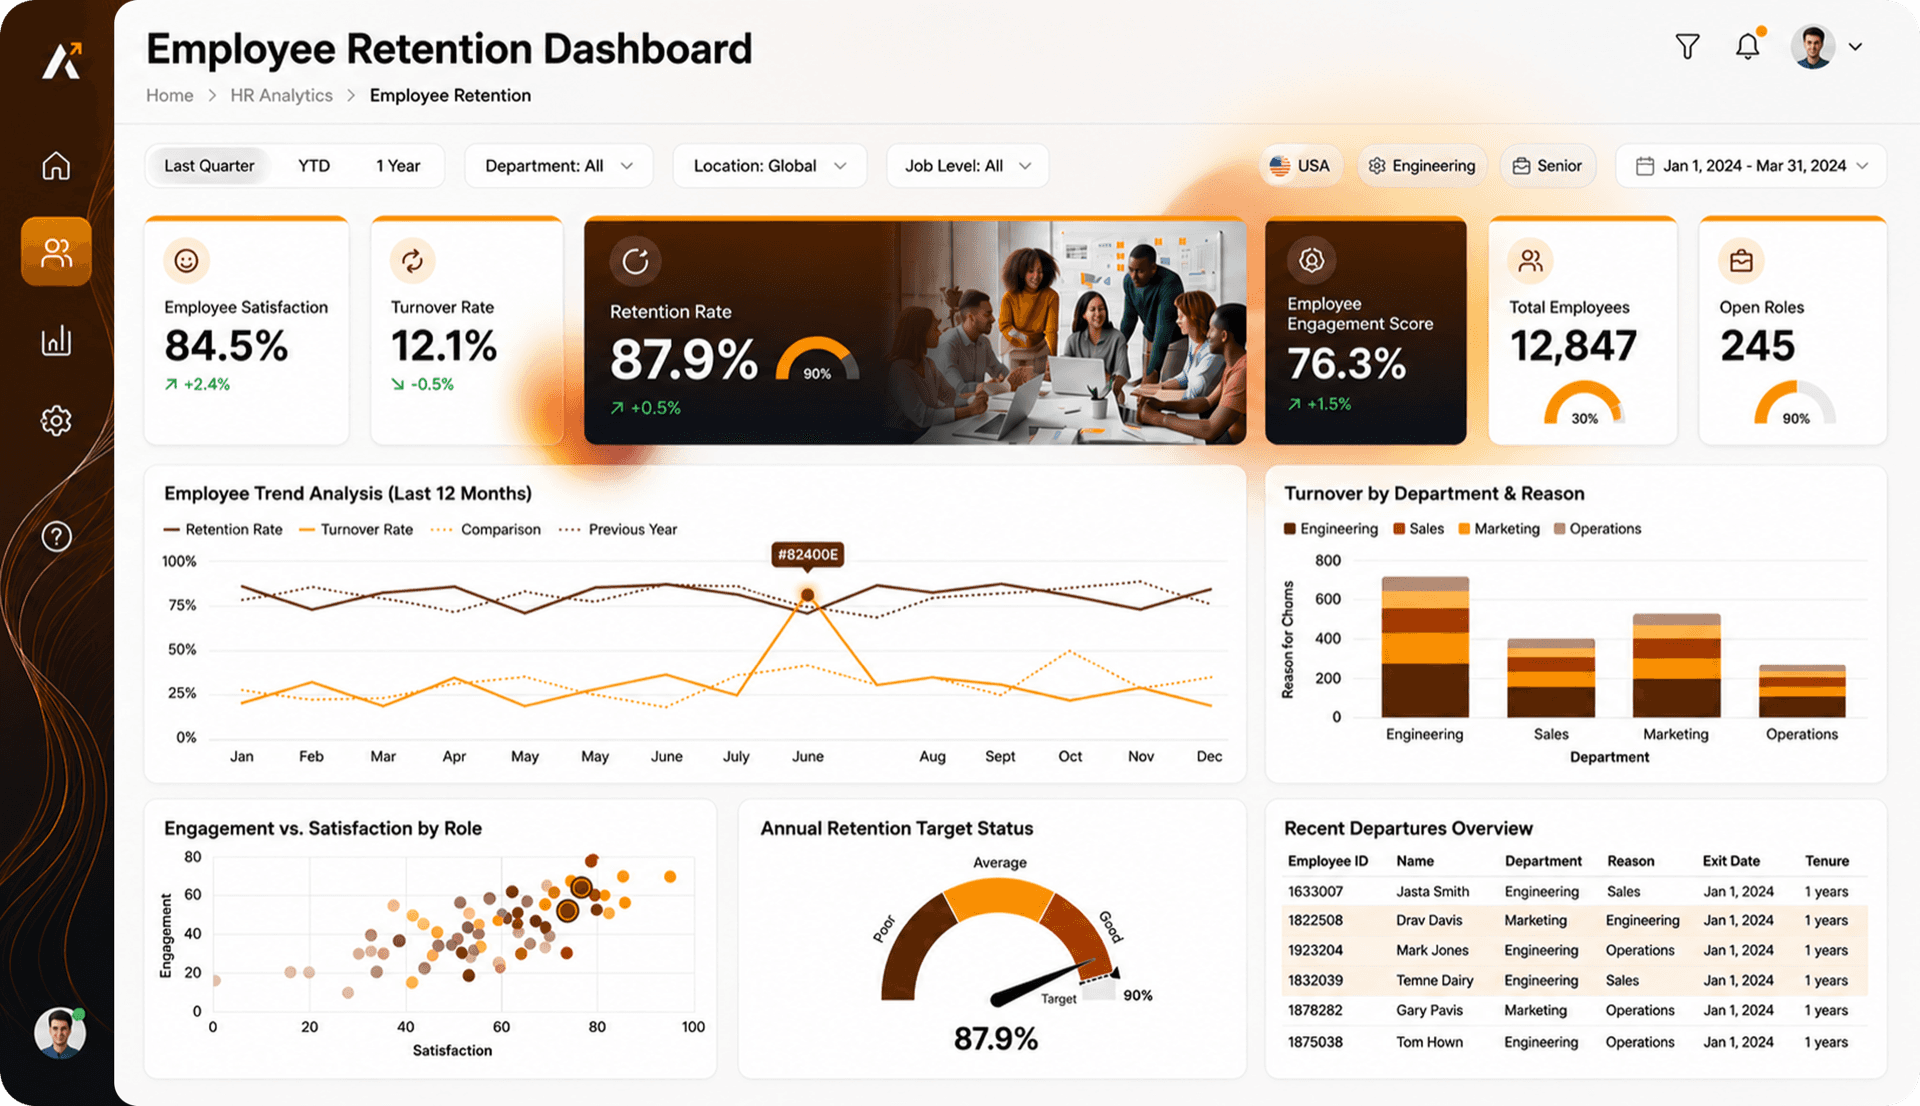
CarePulse Operations Center
See the report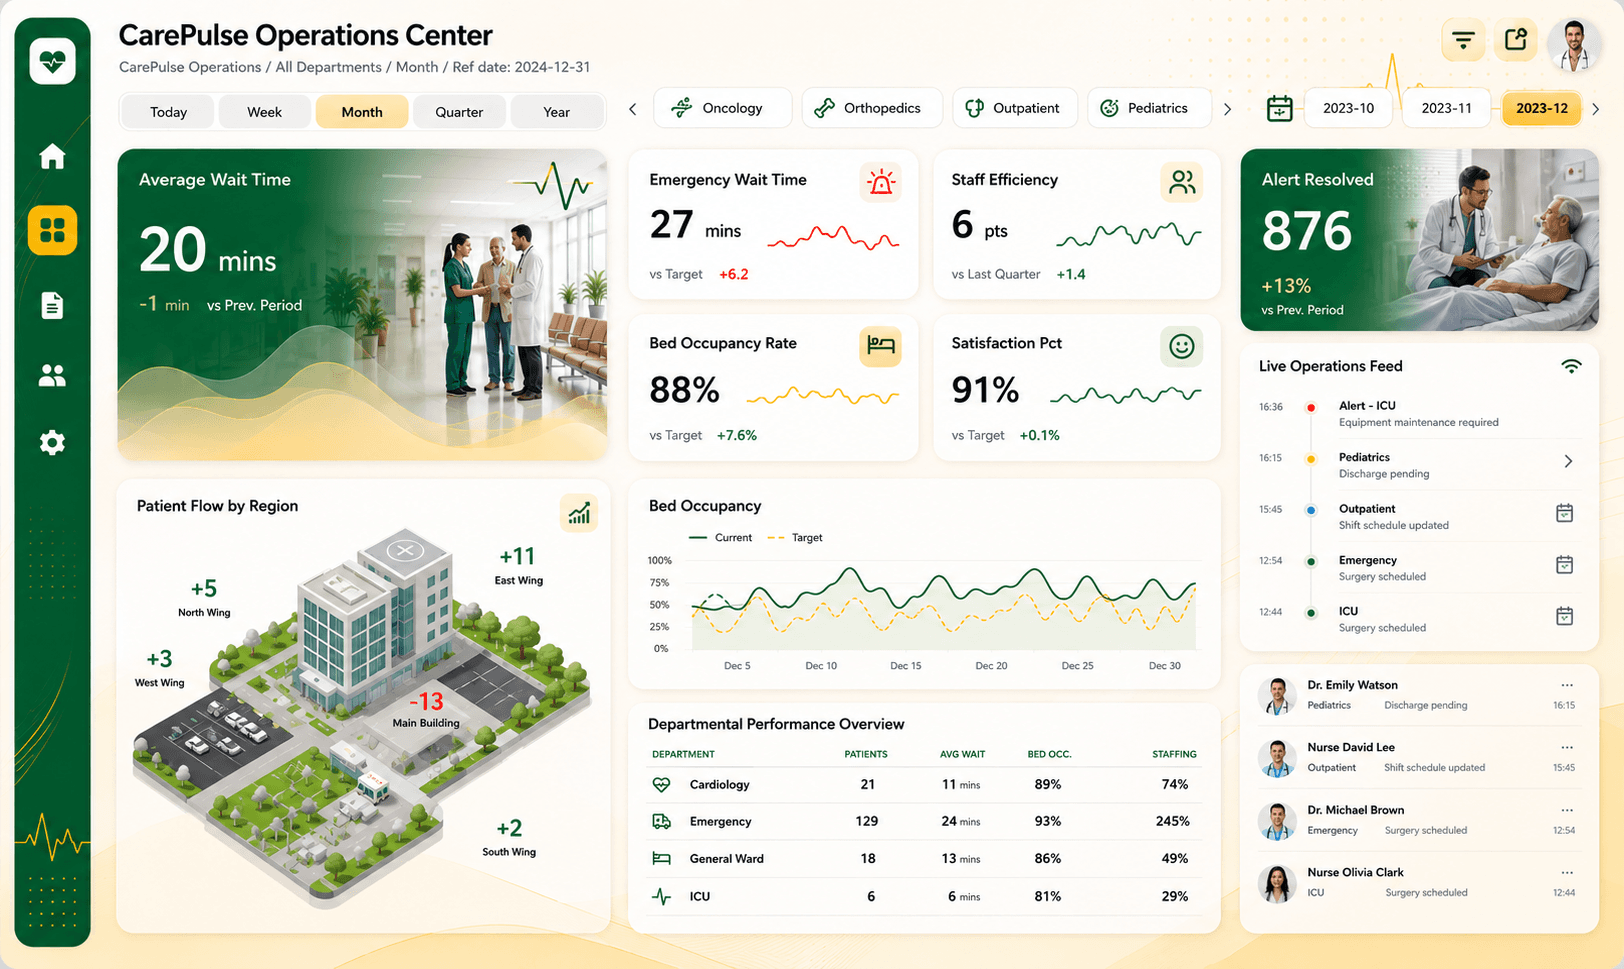
Real reports, built from ChartCraft blueprints. Start from a designed, insight-backed layout, not a blank canvas. Download all three for free.
Stories that stick. Unforgettable.
ChartCraft was born from years of seeing brilliant data trapped in lifeless layouts.
Design with purpose
We saw brilliant data trapped in lifeless layouts. Every visualization should communicate a single insight clearly. Beauty follows clarity.
Empower data pros
We obsess over workflows so analysts can focus on impact, not formatting pixels. Your data deserves to be understood.
Invent with AI
Generative models evaluate structure, balance, and storytelling to propose bold new directions, co-creating dashboards leadership trusts.
Questions
Before you start, the answers.
Plans that fit. See pricing.
Compare plans, explore team options, and find the right fit for your dashboard workflow.
Explore at your rhythm
Ideal for analysts testing ChartCraft on a limited scope, with zero setup friction.
Ship dashboards faster
Designed for power users delivering polished dashboards weekly with deep AI support.
Built for you in five days
Your Power BI report, designed and built on your model and your brand, delivered as a .pbip project you keep.
Ready to forge your first report?
Try Forge free, no account needed. Sign up when you want the .pbip.